Measurement continues to be a key theme at the Resource Recycling Conference
The Resource Recycling Conference (RRC) returned to the Big Easy this year to continue the conversation about materials management practices and to discuss the latest measurement tools and initiatives. Measurement continued to be a strong theme at RRC and the Re-TRAC Connect team is always excited to talk about data.
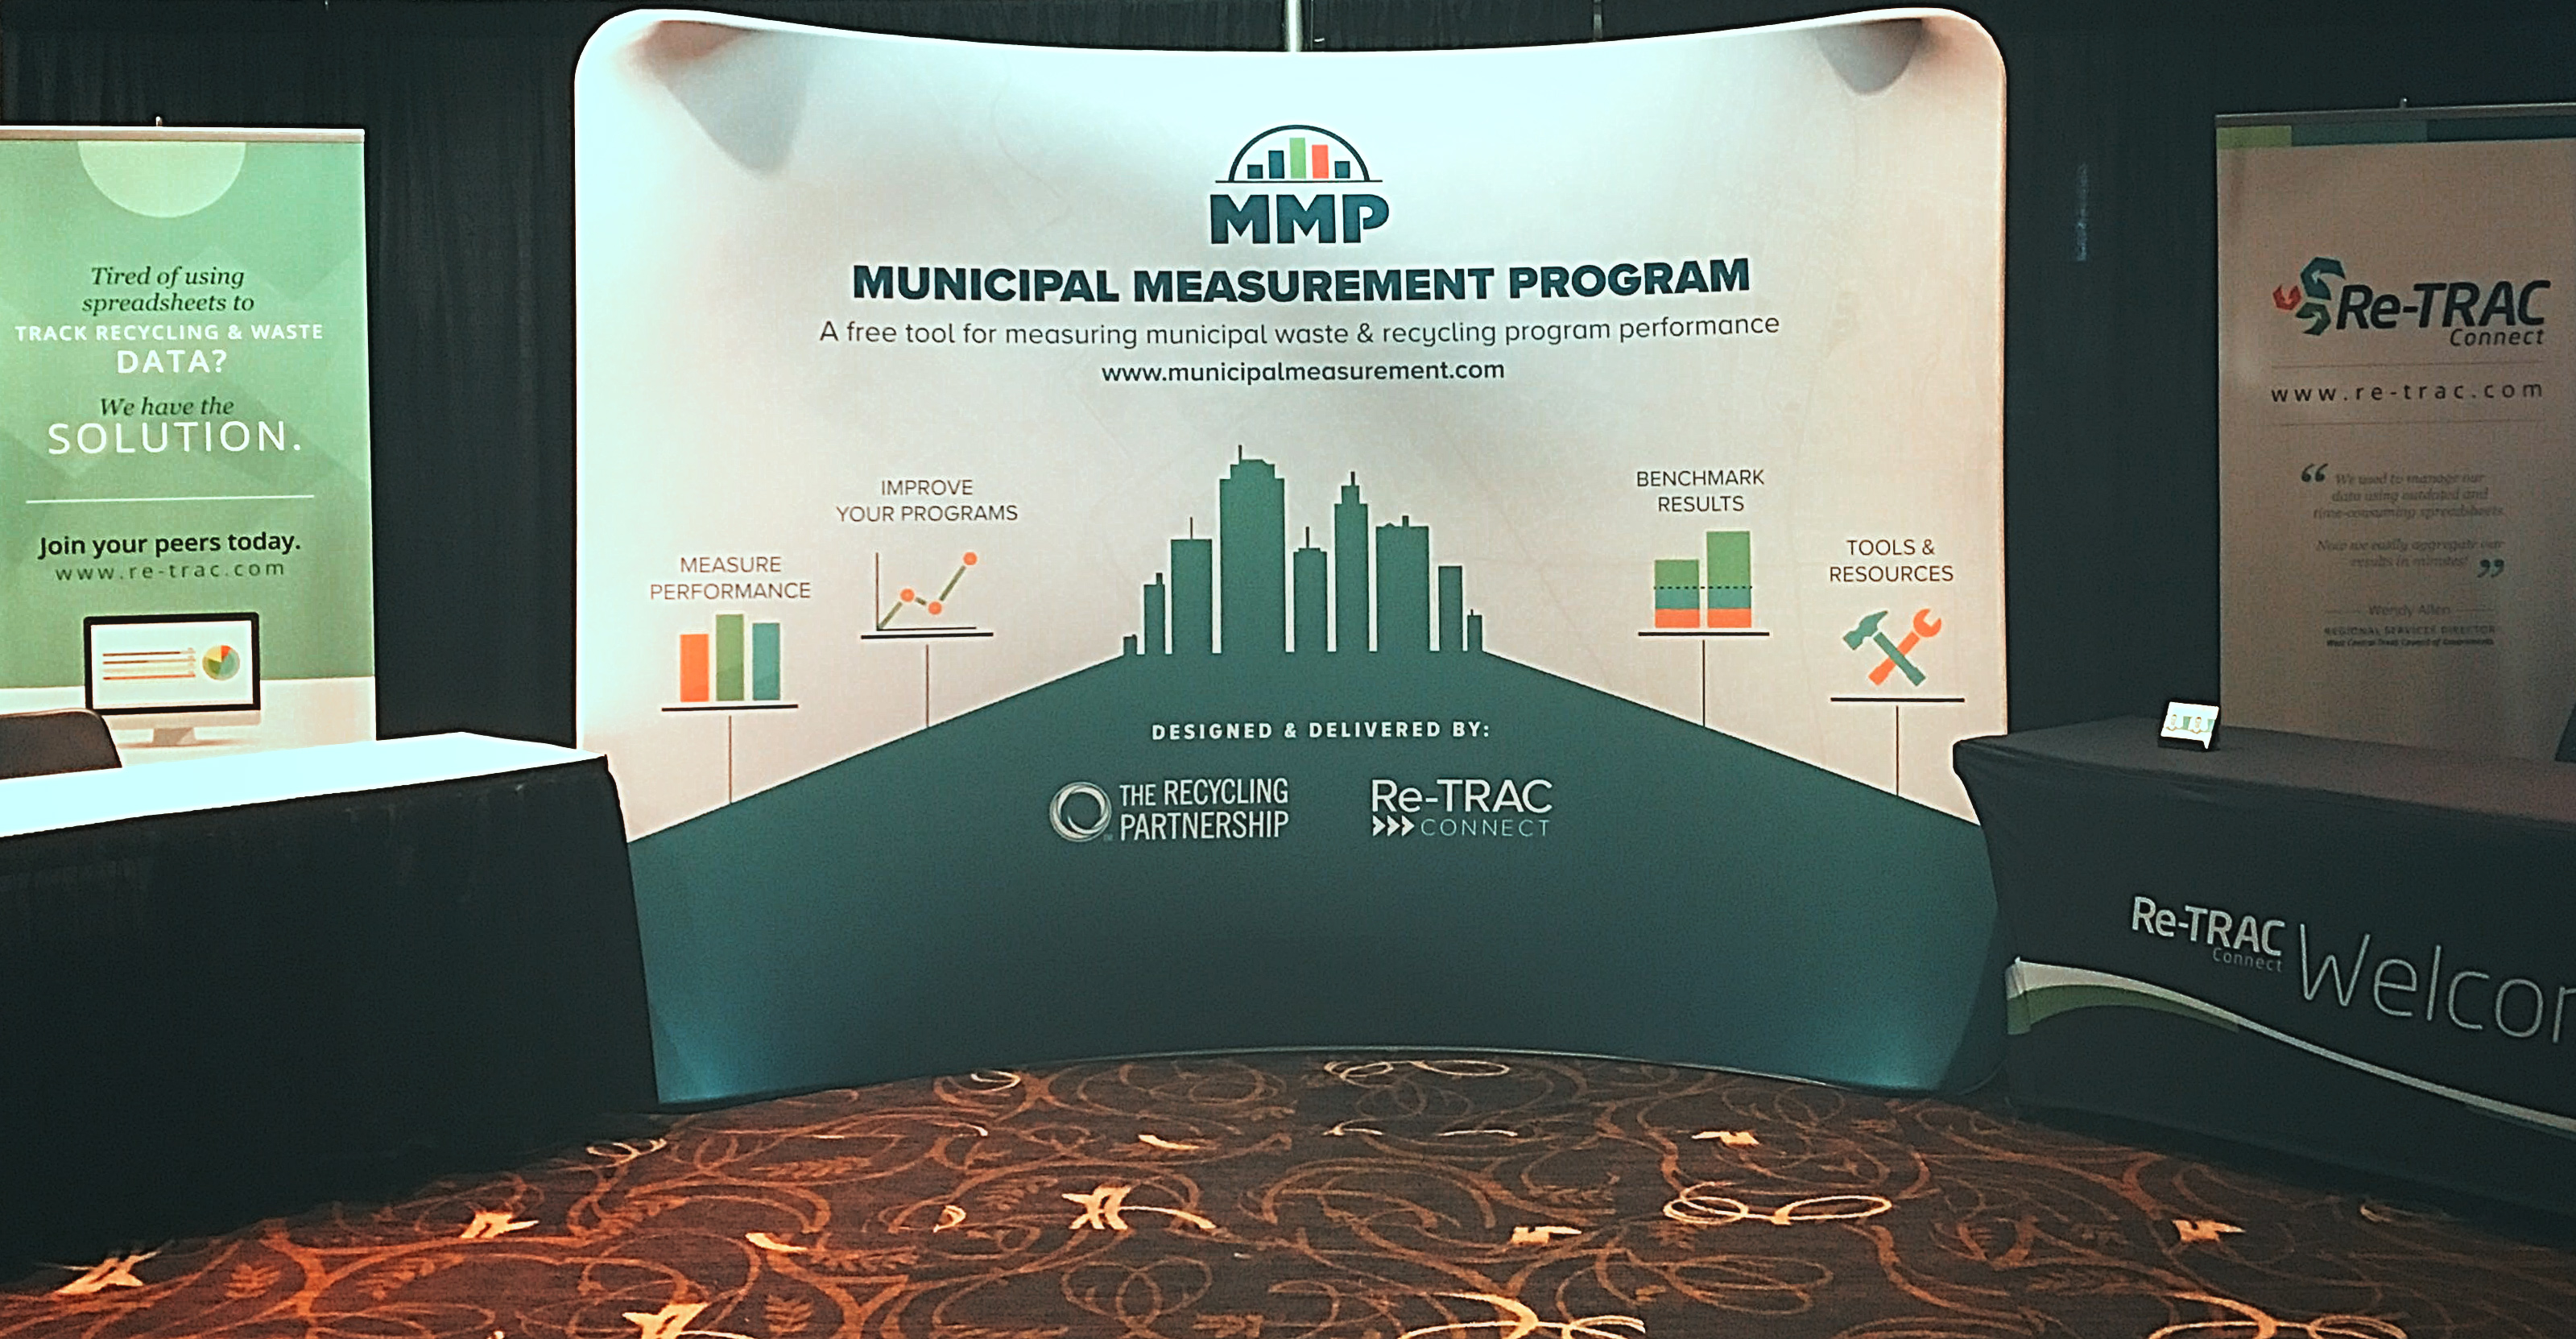
The conference kicked off with the Measurement Matters Workshop delivered by the U.S. EPA and Re-TRAC Connect. Day two included the Tracking Progress plenary session which featured a presentation by Chris Ronson about the analytical power of the Municipal Measurement Program. As always, we brought Party-TRAC back to New Orleans for an evening of bowling and great conversation.